 Consultation


Incoming Material Verification
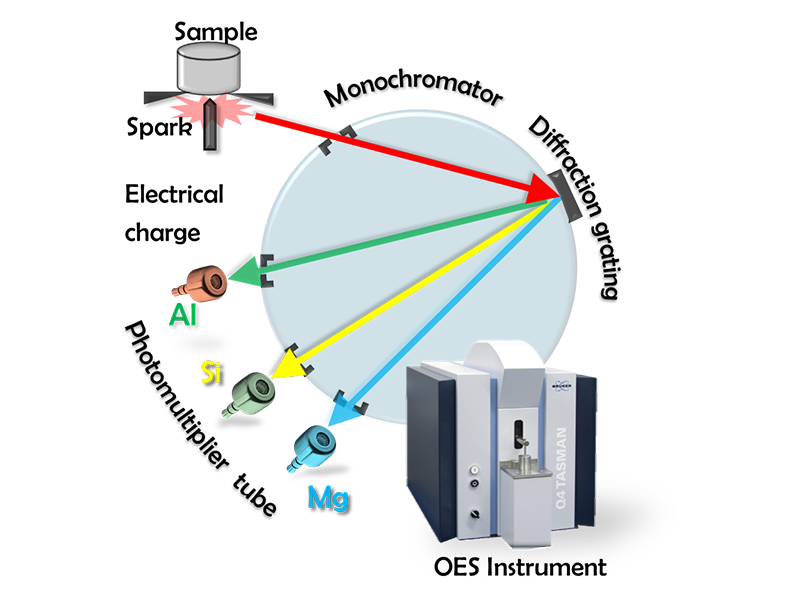
Optical emission spectrometry on a Bruker Q4 TASMAN confirms the full elemental profile of a billet batch, Si, Mg, Cu, Fe, Cr and the rest, against the ASTM specification. When a job calls for it, that composition is used to set the heat treatment window for the batch rather than a handbook default.
The same alloy grade from two suppliers can sit at different points inside the specification. Knowing where a batch sits is what makes the heat treatment repeatable.
Grain Structure by Color Metallography
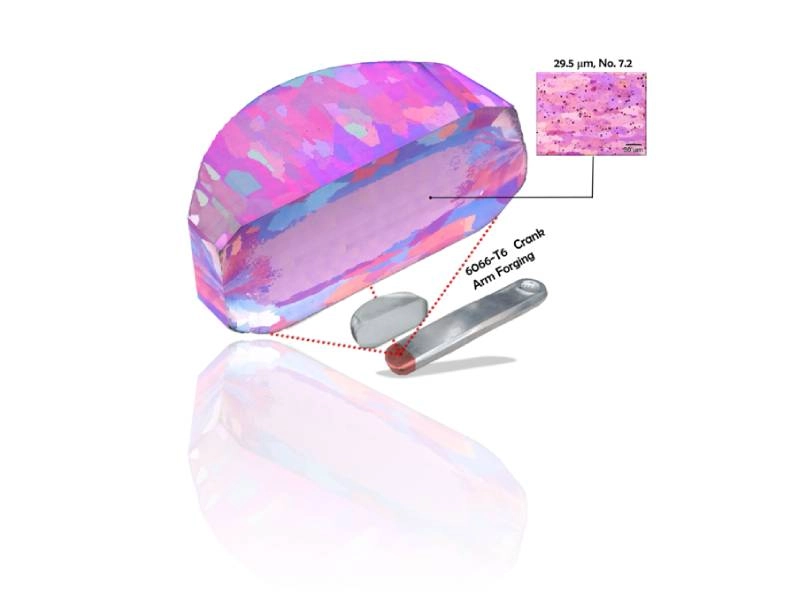
A polished section from the loaded region of the part is anodized in Barker's reagent and imaged under polarized light, so each grain shows in its own color by crystal orientation. Grain size and flow direction are measured across the section and reported as a distribution, not a single number.
This is how we confirm that the forging did its job: fine, continuous grain flow where the part carries load.
Heat Treatment Parameters
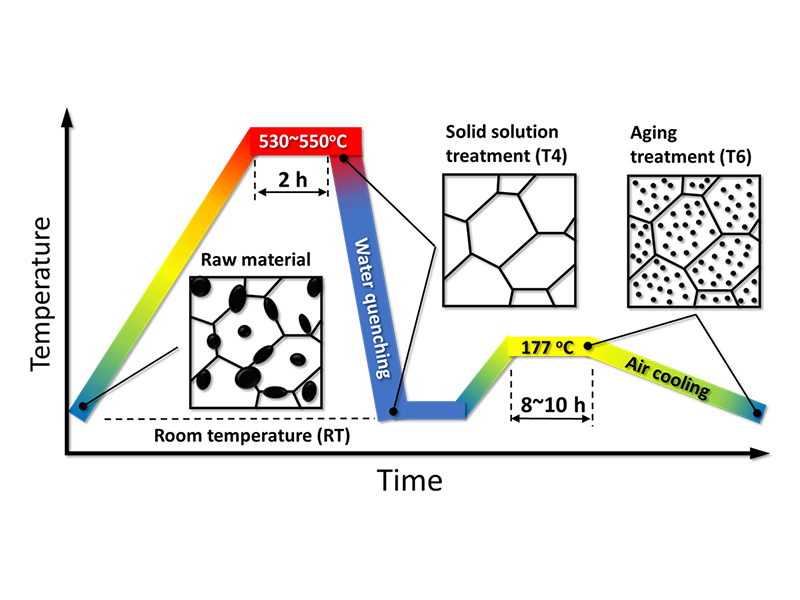
For 6061 the solution treatment window sits at 530 to 550 °C, below the 595 °C onset of melting found by thermodynamic calculation. Water quench holds the dissolved Mg2Si in solution; aging at 177 °C precipitates it back out as fine β″ particles, the structure that gives T6 its hardness.
Parameters are set per alloy and section thickness, and hardness is checked on every load before parts move to machining.
Phase Identification
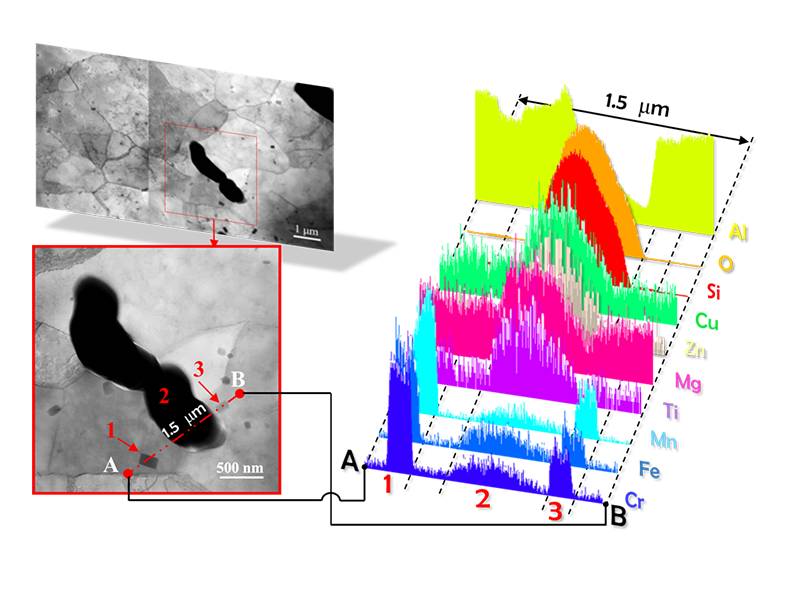
An EDS line scan across grain-boundary inclusions in AA6061-F separates two phase types:
- Al-Si-O phase: thermally active, migrates under elevated temperature
- Al3M phase (M = Ti, Fe, Cu, Mn or Cr): stable, pinned at the grain boundary
Knowing which phases dissolve during solution treatment and which stay in place is what informs the process window.
Microstructural Stability
TEM and EDS show that Al-Si-O inclusions migrate and coalesce at grain boundaries under heat. Keeping solution treatment below 595 °C with a controlled quench rate prevents that degradation.
Production Hardness Baseline
Three production runs of 2,560 pieces measured HRBW 68 to 71 with 95 percent confidence, against an ASTM minimum of 56. Hardness is checked on every load.
Hardness and Fatigue
Published data show hardness tracks tensile and yield strength in wrought aluminum, and for heat-treated 6061 tracks fatigue strength. Hardness is the routine control; fatigue testing is done on request.
Simulation and Test
FEA locates the peak-stress region before physical testing. The in-house fatigue rig then loads the part at the same location and angle, so simulation and test are checking the same thing.
Geometry Over Alloy
Testing shows that section geometry affects fatigue life more than upgrading the alloy grade. A well-designed 6061-T6 section outlasts a poorly designed 6066-T6 one, which is why we ask for the drawing at the development stage.
Fractography
SEM traces crack origin and growth on a failed sample; STEM shows how fine precipitates pin dislocations. Findings go back to the stage that caused them, whether raw material, die design or finishing.
Can you verify the alloy of incoming material?
Yes. Optical emission spectrometry confirms the full composition against the ASTM specification. It is done when a job calls for it, and the report stays with the batch.
What does a metallographic section show?
Grain size and flow direction at the loaded section, laps or folds below the surface, and coarse grain zones from heat treatment. None of these are visible to dimensional inspection.
Do you fatigue-test parts?
On request. Production parts are cycled to failure at several loads on the in-house rig, and the S-N data can ship with the first-article report.


