 Consultation

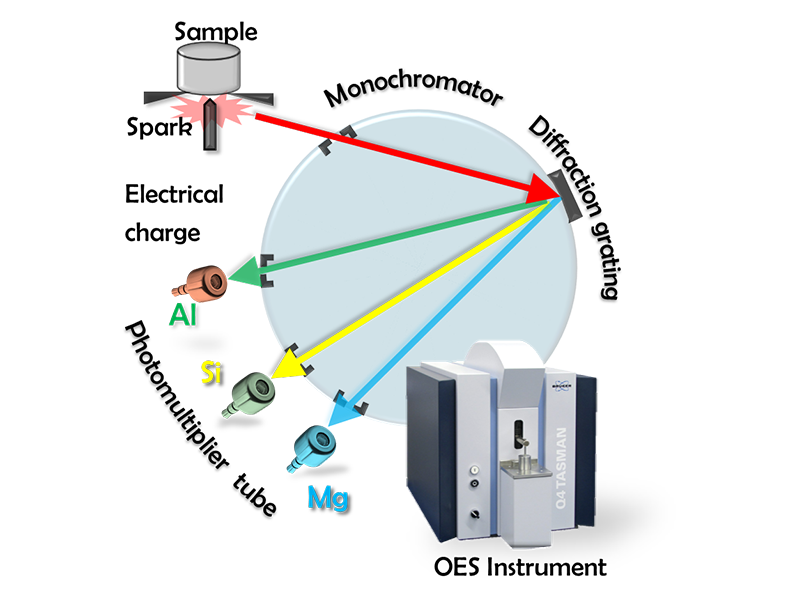
Quality control begins before the furnace is ever lit.
Each incoming AA6061 batch undergoes optical emission spectrometry on a Bruker Q4 TASMAN prior to forging. We verify the full elemental profile — Si, Mg, Cu, Fe, Cr, and beyond — against ASTM specifications, then derive heat treatment parameters specific to that batch's chemistry.
The same process doesn't mean the same settings. Every batch gets its own calibration.
The surface you anodize. The core that endures.
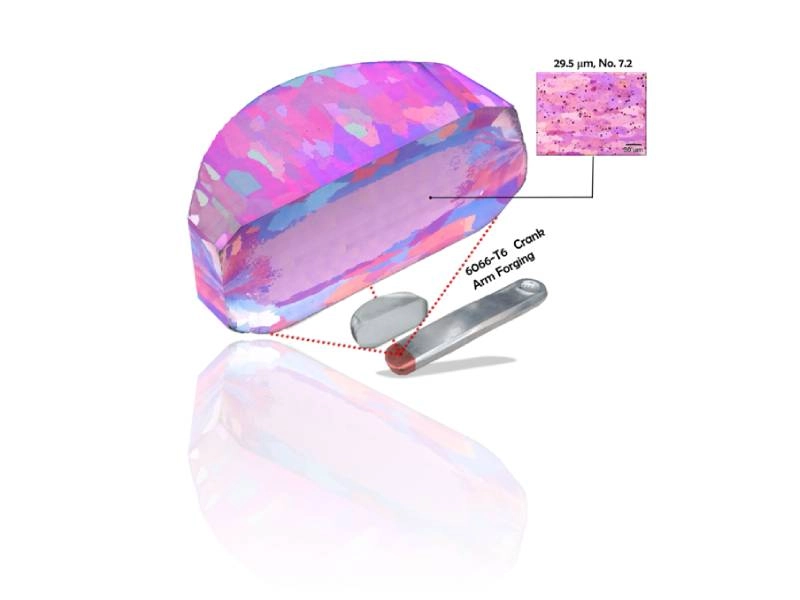
Our forging process deliberately develops two distinct grain zones. Coarse surface grains form the texture anodizing needs to bond properly. Fine interior grains resist fatigue crack initiation when the part is under cyclic load.
We verify this with color metallography — mapping crystallographic orientation in full color across the cross-section. Standard grayscale microscopy can't show what's actually there. This can.
Every parameter is calculated. None are guessed.
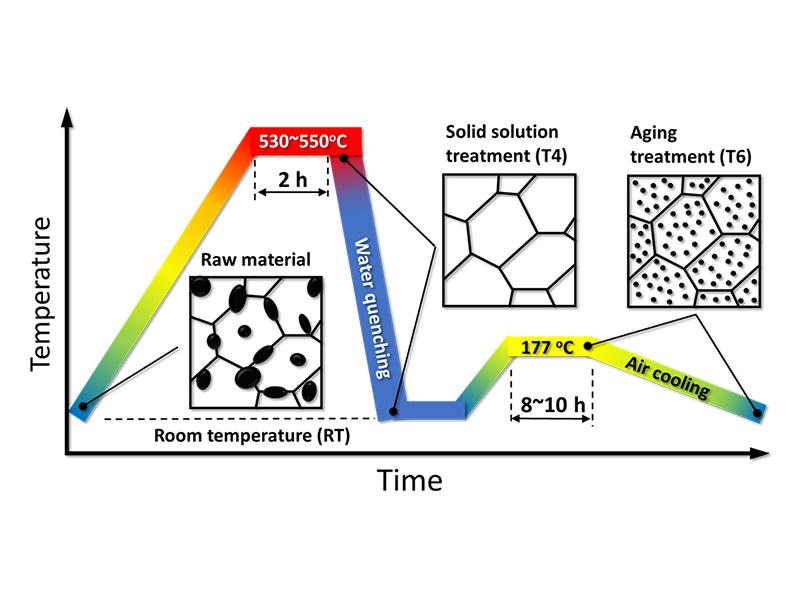
The T4 solution heat treatment window sits between 530–550°C — not arbitrarily, but because thermodynamic analysis places the alloy's onset of melting at 595°C. A deviation of even a few degrees above the ceiling renders the part unrecoverable.
Water quenching follows at 50°C/s — five times the minimum threshold — holding dissolved Mg₂Si in the matrix before re-precipitation can begin. T6 aging at 177°C then precipitates it back out as fine β″ phase: the nanoscale structure responsible for peak hardness.
We identify every phase — at every scale.
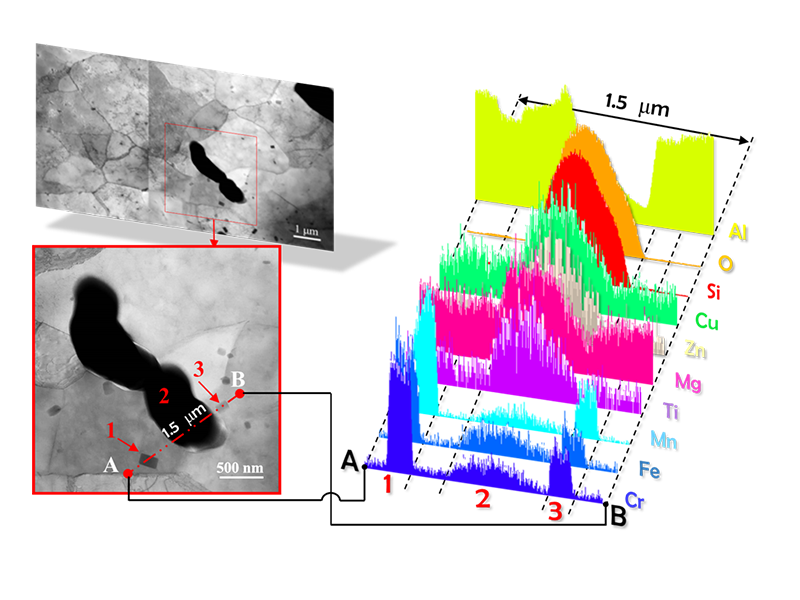
An EDS line-scan across three grain-boundary inclusions (1.5 μm path) resolves two distinct phase types in AA6061-F:
- Inclusion 1 — Unstable Al-Si-O phase: thermally active; migrates under elevated temperature
- Inclusions 2 & 3 — Stable Al₃M phase (M = Ti, Fe, Cu, Mn, or Cr): pinned at the grain boundary
The elemental map distinguishes which phases dissolve during T4 solution treatment from those that remain in place — a distinction that directly informs our process window decisions.
Microstructural Stability
TEM and EDS confirm that Al-Si-O inclusions migrate and coalesce at grain boundaries under heat. Strictly limiting the T4 temperature below 595°C with a fixed quench rate prevents this degradation, ensuring absolute microstructural control.
Production Hardness Baseline
Three production runs of 2,560 pieces consistently achieved HRBW 68–71, exceeding the ASTM minimum by 22–27%. Verified by a 95% confidence interval, this hardness range stands as an established, repeatable production baseline.
Property Correlation
Literature confirms that hardness, yield strength, tensile strength, and fatigue life scale proportionally across wrought aluminum alloys. Engineering our T4/T6 process to maximize hardness directly translates quality data into a reliable fatigue life commitment.
Simulation & Test Alignment
Before physical testing, FEA maps cyclic stress to pinpoint the exact peak stress location driving fatigue initiation. The in-house fatigue rig replicates this condition identically, ensuring simulation and physical validation are aligned by design.
Geometry Over Alloy
Testing proves that section geometry influences fatigue life far more than simply upgrading the alloy grade. Optimizing a 6061-T6 cross-section outlasts a poorly designed 6066-T6 part, making pre-production geometric collaboration a standard requirement.
Nanoscale Anti-Cracking
SEM tracks crack propagation from a single source, while STEM reveals that nanoscale precipitates pin dislocation movement. Our T6 aging process delivers fine, uniformly distributed precipitates that delay micro-crack nucleation to extend fatigue life.


